Energy Tracking Provides Solution for Energy Management:
Energy Tracking’s software development group has worked hard over the years to provide ideal solutions when it comes to local and global energy monitoring and management for end users.
Our goal is to help end user’s achieve their target goals with regards to energy usage and energy management. If you have not reviewed the "Energy Monitoring" preview; please do so now.
Acquisition of accurate and timely energy metering data is key before energy management can be performed. Energy Tracking’s R&D group has also worked hard to provide ideal hardware technology
that is proven and will consistently provide accurate and timely data and reports.
We have designed and built Enterprise Energy Tracking Analytics (ETA); a web portal hosted solution that allows end users immediate and long term access to energy usage information.
ETA is an enterprise level energy management software web portal that automatically collects and manages valuable energy data and then translates the data into useful and actionable insights to users. ETA’s cloud-based robust data capture and analysis help users gain control over their energy costs via variety of interactive and automated energy analytics tools that are delivered via a convenient and easy to use web browser.
ETA manages large volumes of historical data from meters. It presents current data up to the last granular interval, hourly, daily, and monthly or yearly as well as historical data both in tabular and graphical form providing greater visibility and control of energy consumption.
ETA helps uncover hidden saving opportunities in complex energy environments.
Energy Tracking’s proven metering technology and global implementation to over 32 countries world-wide provides best-in-class data analytics capabilities and is an established leader in providing smart energy solutions to help improve operational efficiency, strategic energy management and provide greater visibility.
ETA’s value delivery framework with extensive energy domain expertise provides comprehensive strategic energy management solutions, cost tracking/reduction and more.
The combination of our hardware and software technologies enables end user’s to execute and achieve their goals towards energy metering, measurement, monitoring and management. The following documentation is
an effort to show how energy management can best be executed over time based on data reported to ET Analytics. Note: It is also possible for 3rd parties to provide the same type of reporting using the XML data reported by our devices.
Data Sheet for ETA:Click Here.
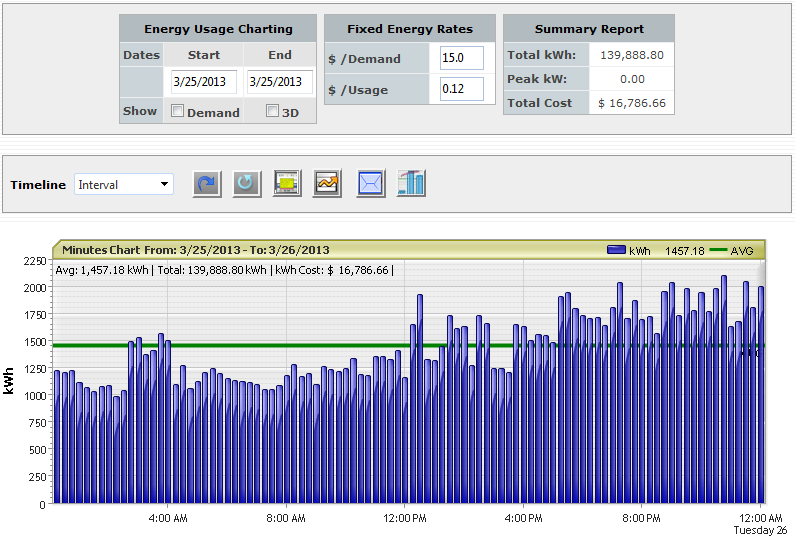
Let’s start with Interval / Load Profile Energy Usage Data:
Energy Tracking’s meters will report energy usage periodically - say every 15 minutes or as fast as every 1 minute. This enables immediate review of modifications that result in an increase / decrease of energy usage.
Energy Tracking Analytics (ETA) can show you exactly where, when and how much energy your facility has consumed and aid in energy management. Data is updated to ETA within 1 minute after it is reported.
Interval Data Graph - Load Profile Capability:
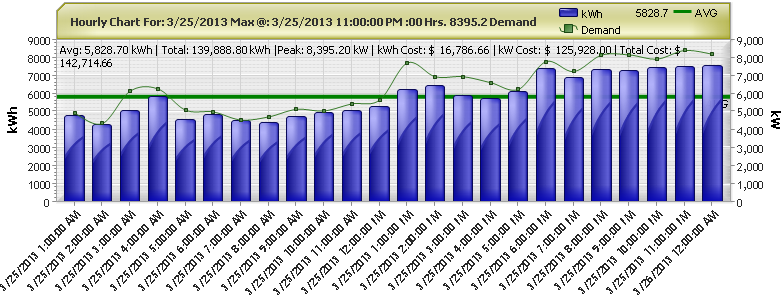
ETA also calculates the peak demand for hourly, daily and monthly charting as shown below.
Hourly Usage and Demand Data Graph:
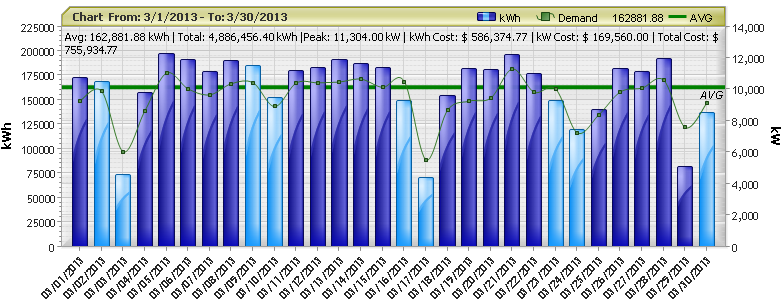
Daily Data Graph:
Monthly Data Graph:
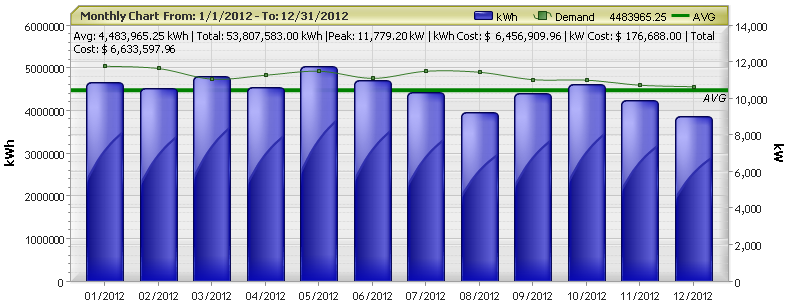
ETA provides a quick visual of energy usage and demand overtime as shown above to help in energy management. These reports can be printed, emailed and customized based on user color preferences.
Monthly Data Aggregation Graph:
ETA can also aggregate the energy usage by hourly, daily and monthly charting as shown above.
Baseline Data Graph:
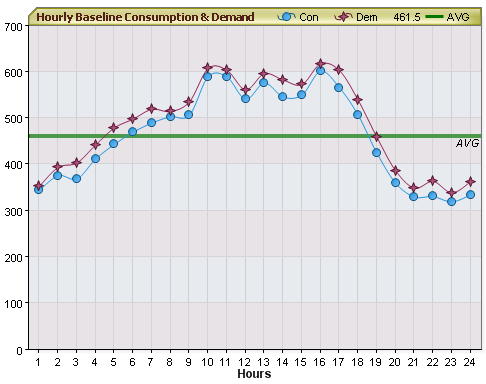
ETA also allows users to generate and store Baselines energy usage shown above.
Comparison Baseline Data Graph:
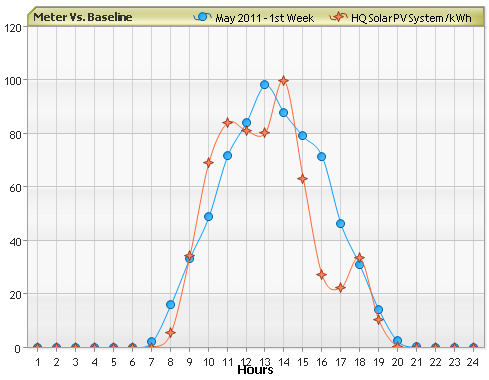
ETA also allows users to Compare Baselines energy usage shown above. Comparisons can be done meter v/s meter, meter v/s baseline as well as baseline v/s baseline to help in energy management.
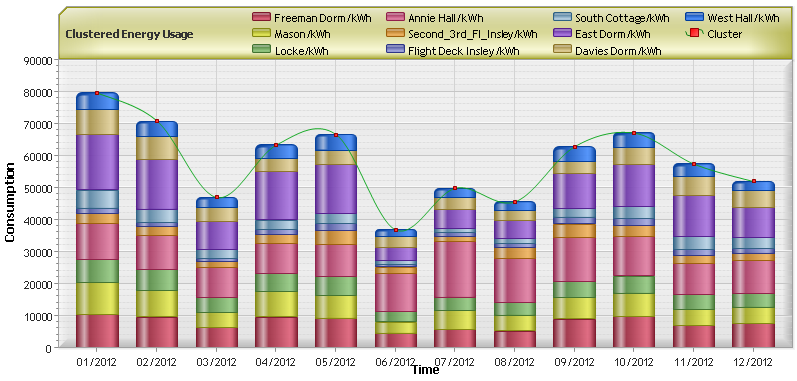
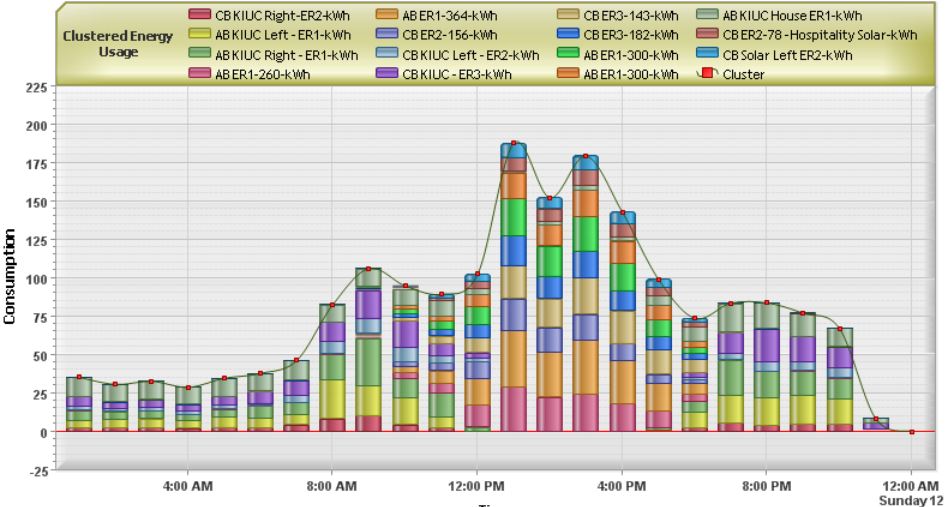
Energy Tracking Analytics also allows the user to Cluster / Group Usage from Multiple Meters.
Clustering:
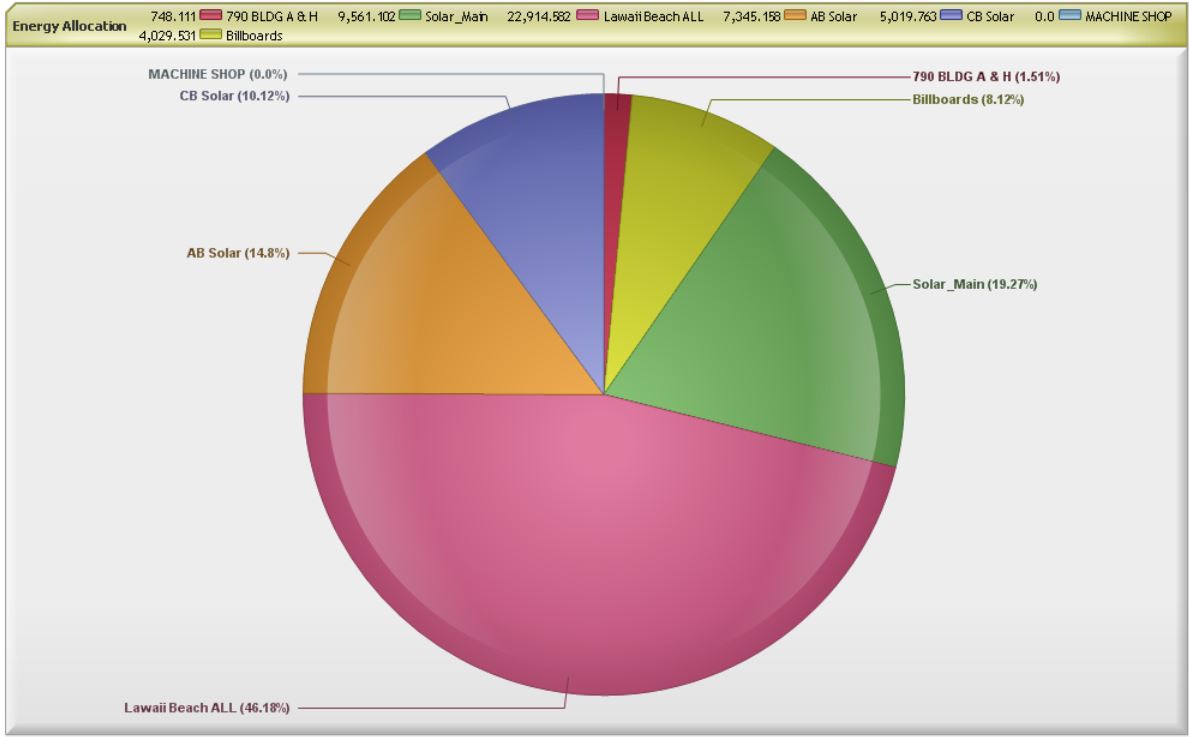
Energy Tracking Analytics also allows the user to Allocate Energy Usage from Multiple Meters.
Energy Allocation:
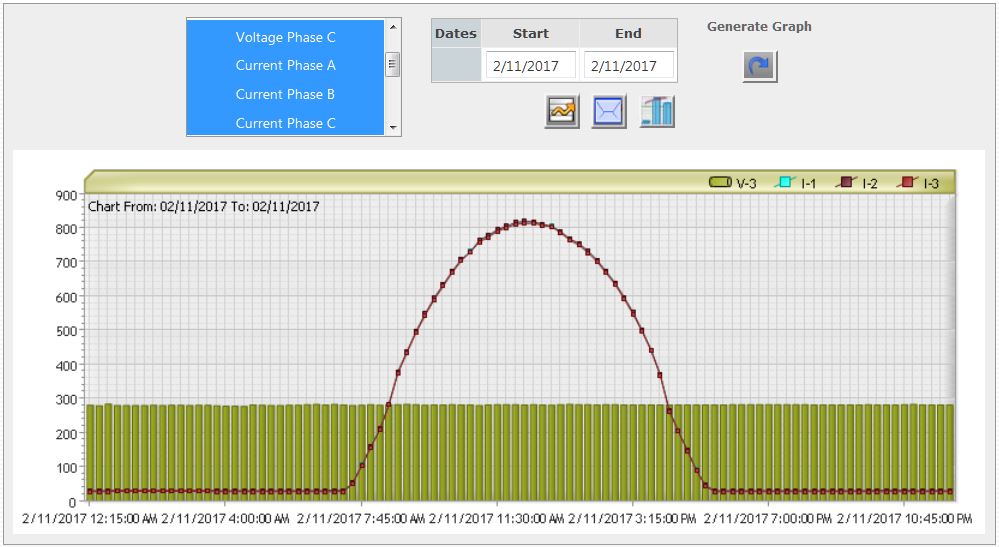
Energy Tracking Analytics also allows the user to track combined Voltage, Current, Power Factor and Demand. Example of Voltage and Current Tracking.
Power Analysis:
Tariff Module:
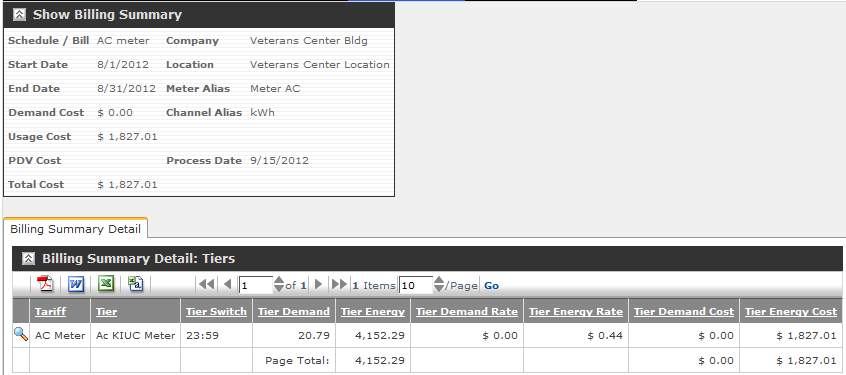
ETA also allows users to create complex tariffs by Time-Of-Use, Ratchet, etc. and generate bills. This is another step in helping towards energy management.
Please review WEM-MX Screen Shots & ET Analytics.
| Company | Solutions | WEM-MX Electric Meter | WEPM Pulse Data Logger | ET Analytics | WEM-MX Screen Shots & ET Analytics. | Latest News | Reports | Overview | Applications
|